1. Where does McDonald’s data come from?
McDonald’s collects data to better predict changes and what factors will change customer expectations, behaviors and trends.
McDonald's regards the restaurant as an overall system and integrates data from more than 34,000 branches to establish a global data warehouse.
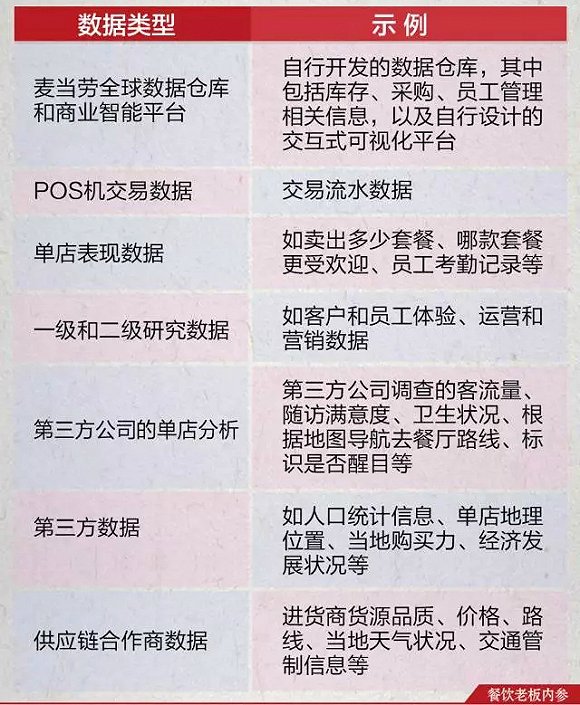
The data used in its daily decision-making include:
In addition, McDonald's has also developed an App that allows customers to choose the nearest store and order food on their mobile device before arriving at the store. This not only saves time, but also helps McDonald's accumulate a large amount of user data.
2. How to use McDonald’s data?
1. Analyze the differences between stores
For chain brands, average data compiled from multiple stores can be used to make management decisions, but there is no way to reflect the true situation of each single store. Therefore, chain brands need to conduct "personalized" management of branches.
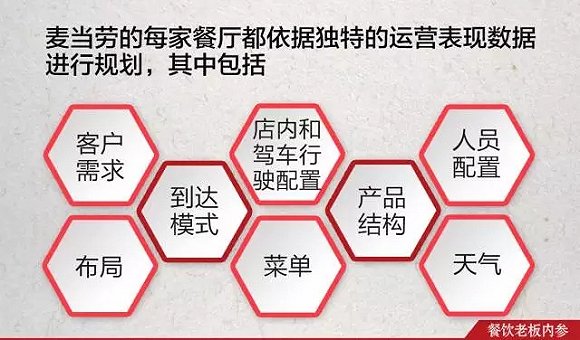
For example, a branch in Chicago needs to be equipped with a cold drink machine, but a branch at the Houston Airport may need six such machines due to the heavy traffic of passengers waiting for flights.
McDonald's integrates data and uses visualization to better help store managers or company managers understand the causes of differences between stores. Analysts will provide a visual description platform to individual store managers and managers. Managers can quickly and accurately understand their operations at any time through iPad operation.
For example: today’s employee work schedule, who is on sick leave, how many set meals are sold during breakfast time, how many pounds/bags of meat patties, sausages, hash browns are purchased, how many pounds of French fries are made, how many minutes it takes on average to serve each meal, etc.
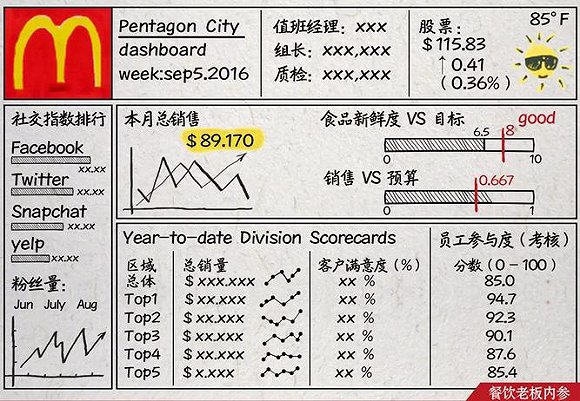
The picture above shows the performance visualization interface of McDonald's Pentagon City branch in Virginia. The left side of the picture shows the social media index ranking and the number of fans in the past three months. The backbone of the picture includes total sales/growth trends for the month, food freshness, and sales budget proportion versus target. In addition, the picture also includes regional single store summary data: total sales during the year, customer satisfaction, and employee participation.
2. Use models to simulate future business conditions
Managers can also simply operate the interactive predictive model, input different parameters into the model, and then perform digital simulation analysis.
For example, what will be the results if a few more employees are added, how much will the cost increase, how much will the profit change, etc. The system automatically updates the branch's operating data every 15 minutes, allowing managers to quickly decide on matters that should be improved at any time.
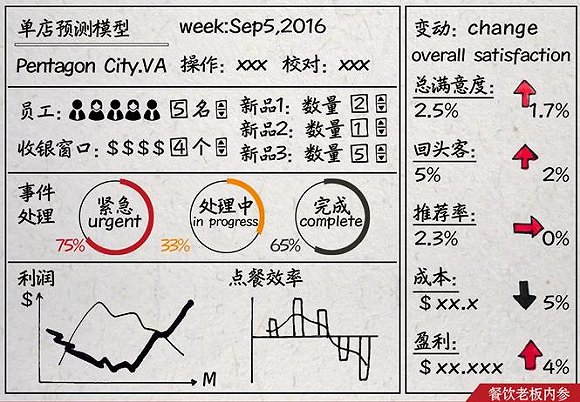
The picture above shows the interactive interface of the predictive model of McDonald's Pentagon City store in Virginia. The right side of the picture shows the main variables reflecting performance. When the number of employees increased to 5, 4 cashier windows were used, and 2 new product No. 1, 1 new product No. 2, and 5 new product No. 3 were launched, the total satisfaction rate reached 2.5% (an increase of 1.7 percentage points), repeat customers increased by 2 percentage points, costs decreased by 5%, and profits increased by 4%. In addition, due to the adjustment of the number of employees, the efficiency of incident processing will be increased. The corresponding changes in total profit and ordering efficiency can also be seen at a glance.
It can be seen that predictive analysis can not only visually display the business status, customer and employee management of each store, but also make future plans. You can intuitively see the results of changes without paying "tuition".
For example, based on the surrounding environment and passenger flow of a certain supermarket store, predict the best restocking time and employee allocation. When a new company or office building is opened nearby, the store should add a few more employees. Does the restocking time need to be advanced? If there are many young employees in nearby companies, whether it is necessary to add coffee machines, cold drink machines, etc.
3. Use eye tracking technology to understand customers
As part of the simulation model, McDonald's also uses eye-tracking technology to learn how customers view a restaurant. The information they capture includes:
·What is their route into the store?
· What interactions do you have with ordering staff?
· Will there be an internal kitchen and an order board?
·What do you do after ordering food?
Additionally, video analytics can be used to track the time customers spend dining in-store or ordering without stopping.
4. Reasonably design non-stop ordering routes and services
Another example of McDonald’s success using big data is optimizing the drive-thru experience.
They analyzed three important factors:
· Design of driving lanes
·Information provided to guests at their drive-thru
·Guest waiting time in line
For example, if a customer only wants to order a milkshake, but happens to be in line behind a mid-size car whose family is ordering, the milkshake customer will be unhappy. McDonald's therefore needs to analyze demand patterns.
McDonald's approach is to use cameras outside the store to capture surrounding traffic conditions, combine indoor and outdoor data, and use video analysis and 3D simulation of vehicle driving patterns outside the restaurant to determine passenger flow and order waiting efficiency, thereby optimizing the design of driving lanes and sales windows and improving the dining experience for customers who do not enter the store.
McDonald’s has optimized this tool and made it into an analysis platform. Operators can conduct visual interactions on tablets, use 3D simulation to add vehicles into lanes and add them to the model, and learn people with different characteristics (such as age group, race, vehicle classification)their driving habits and behaviors.
For example, young drivers driving sports cars will drive into the driveway at a faster speed and brake suddenly at the ordering window. In this way, they may not see the new product promotion sign placed at the entrance of the driveway for customers queuing up.
Drivers of large and medium-sized vehicles may park farther away from the sales window. They may open the door or even get out of the car if the card machine cannot reach the window, which will take more time.
Children ordering for a large family may need more time to decide what they want to eat. Some parents will wait patiently for their children to confirm before ordering.
(The author of this article is a special reporter for Restaurant Boss Internal Reference, a senior statistical analyst and a brand strategy consultant at Gallup Consulting Company.)